
The Bureau of Economic Analysis (BEA) released the 2023 Gross Domestic Product (GDP) data for U.S. counties on December 4, 2024. This article highlights the inflation - adjusted, i.e. real, GDP figures for each county in Texas, providing insights into their growth trends, economic health and output from 2019 to 2023.
The dashboard below features a shaded map illustrating the distribution of real GDP across Texas counties for 2023. Counties with lower real GDP are represented in lighter blue shades, while darker shades indicate higher GDP levels. Below the map is a bar graph comparing the growth rates of individual counties from 2019 to 2023 with the growth rates of Texas and the U.S. for the same period. The bar graph also features the real GDP share of the county in comparison to the state real GDP. By hovering over a county on the map, users can view its specific growth rate and GDP contribution relative to Texas as a whole.
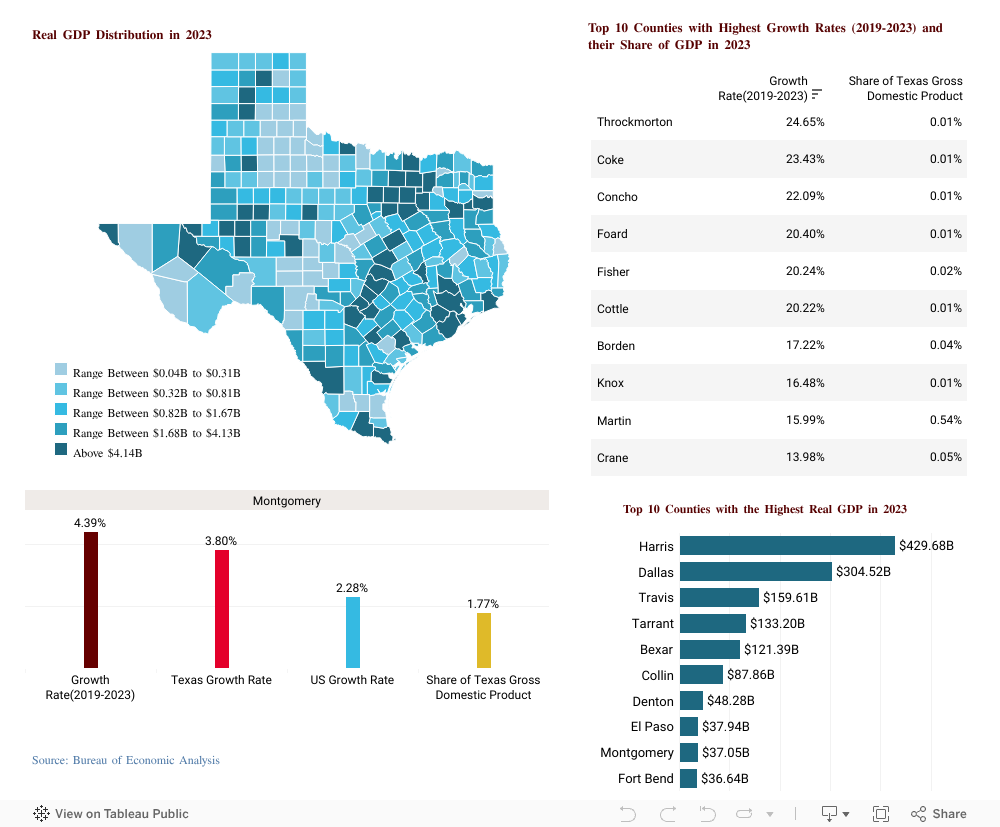
For example, hovering over Brazos County reveals a growth rate of 4.43% from 2019 to 2023, compared to Texas’ growth rate of 3.80% and the U.S. rate of 2.28%. Brazos County’s contribution to Texas’ GDP was 0.58% in 2023.
Alongside the map, two static visualizations provide additional context. One table lists the top ten counties with the highest growth rates between 2019 and 2023, along with their GDP shares relative to the state’s total GDP in 2023. The second is a horizontal bar chart illustrating the top ten counties with the largest real GDP in 2023.
Growth Rate
Figure 1 highlights growth rates across Texas counties, comparing them to the state’s growth rate of 3.80% from 2019 to 2023. Of the 254 counties, 95 exceeded the state growth rate and are shaded maroon, while the remaining 159 counties, shaded gold, fell below the state average.
The 95 higher-growth counties collectively contribute 30.9% of Texas’ total GDP in 2023—equivalent to $647.03 billion out of the state’s total GDP of $2,097.09 billion. The other 159 counties account for 69.1% of Texas’ GDP.
The top 10 counties with the highest growth rates contribute 0.7% of Texas’ GDP. Their combined GDP in 2023 amounts to $14.71 billion, a small fraction compared to the state’s overall GDP.
Figure 1. GDP Growth Rate by County Relative to State Average

Source: Bureau of Economic Analysis.
This raises an important question: which industry drove the growth of the top 10 counties with the highest growth rates from 2019 to 2023? Table 1 below highlights the industry with the most significant growth during 2019-2023 for these counties and the share of this industry GDP to the county's real GDP.
Table 1. Highest Growth Industries to the top 10 Highest Growth Counties

Source: Bureau of Economic Analysis, Industry Detail.
The table highlights that Utilities,[1] along with Mining, Quarrying, and Oil and Gas Extraction, are the two dominant growth industries across the top 10 high GDP growth counties in Texas. Mining, Quarrying, and Oil and Gas Extraction have been the leading sectors in Borden, Crane, Fisher, and Martin counties, with annual growth rates of 10.9%, 14.1%, 37.7%, and 17%, respectively. These industries significantly contribute to each county’s GDP as shown in the Table, underscoring their economic reliance on resource extraction. The utilities sector has shown remarkable growth in counties like Coke, Concho, Foard, Knox, and Throckmorton, with striking annual growth rates of 242.9%, 55.1%, 38.9%, 58.0%, and 397.2%, respectively. Cottle County stands out as the only exception among these high-growth counties, where professional and business services lead as the fastest-growing sector, achieving an annual growth rate of 125.4%.
Share of Each County to the Texas GDP (2023)
The counties with the highest growth rates are not the ones that make the largest contributions to Texas’ GDP. For instance, Harris, Dallas, and Tarrant counties all have growth rates below the state average of 3.8% from 2019 to 2023. Specifically, Dallas grew at 3.1%, Tarrant at 2.8%, and Harris at 2.9%. However, their contributions to Texas’ GDP are substantial. Harris County alone accounts for 20.5% of Texas’ GDP, followed by Dallas County at 14.5%. Combined, these two counties contributed $734.20 billion in real GDP in 2023, or 35.0% of Texas’ total GDP. This exceeds the combined GDP share of the 95 high growth (above state average growth rate) counties.
Figure 2 illustrates the distribution of the share of GDP of each county in Texas compared to the overall average share of 0.4%. There are 34 counties (shaded in maroon) which have shares above the overall average share of 0.4%. Together they contribute $1759.7 billion or 83.9% of the total Texas GDP. The remaining 220 counties have shares below the average of 0.4%.
Map 2 : Distribution of the Share of Each County Relative to the Average Share 2023

Source: Bureau of Economic Analysis.
Of the $1,759.7 billion in real GDP contributed by the 34 above-average share counties, 79.3% comes from the top 10 counties, with individual county shares ranging from 20.5% to 1.7%.
Texas counties exhibit a diverse economic landscape. Over the past 5 years, smaller counties with high growth rates, such as Throckmorton, Coke, and Concho, achieved remarkable annual increases of 24.6%, 23.4% and 22.0%, respectively, fueled by the resource extraction and utilities industries. Together, the top 10 high GDP growth counties collectively contributed only 0.7% ($14.71 billion) to the state’s GDP in 2023. Meanwhile, larger metropolitan areas like Harris and Dallas, with growth rates below the state average of 3.8%, accounted for 35.0% of Texas’ GDP, totaling $734.20 billion.
Footnote
[1] The Utilities sector comprises establishments engaged in the provision of the following utility services: electric power, natural gas, steam supply, water supply, and sewage removal. Within this sector, the specific activities associated with the utility services provided vary by utility: electric power includes generation, transmission, and distribution; natural gas includes distribution; steam supply includes provision and/or distribution; water supply includes treatment and distribution; and sewage removal includes collection, treatment, and disposal of waste through sewer systems and sewage treatment facilities. North American Industry Classification System (NAICS).