
In the 1960s, Mexico was governed by the Institutional Revolutionary Party (PRI), which combined populism and authoritarianism to maintain a firm grip on power.[1] Concurrently, South Korea was under the authoritarian rule of Park Chung-hee. Both Mexico and South Korea adopted strategies that emphasized industrialization and government intervention in the economy. They prioritized infrastructure development and sought to attract foreign investment to spur growth. While Mexico relied more on its natural resources, South Korea focused on human capital and technological advancement. This blog explores the economic output of Mexico and South Korea focusing on gross domestic product per capita by the working-age population, and tracks its trends from 1960 to the present.
Real GDP measures the inflation-adjusted final value of all goods and services produced in a country, a measure of total economic output. Real GDP per capita measures each person’s pro rata share of real GDP, which can be used to measure average income considering all income sources (and not just wages). Real GDP per working age population measures output per worker, a measure related to productivity.
Gross Domestic Product (GDP) per capita by the working-age population offers a crucial perspective on economic performance, emphasizing the productivity of the nation’s workforce. Countries differ in the proportion of their population that is of working-age, referring to individuals aged 15 to 64. Countries with high birth rates typically have a pyramid shape to their population arranged by age, with large numbers of young compared to old. Countries with low birth rates typically have more of a rectangular structure to their population arranged by age. Over time, both Mexico and South Korea have seen slowing growth rates and therefore changes in their demographic structure, but South Korea’s population growth has slowed more, and began slowing earlier in time than Mexico.
Source: World Bank, World Development Indicators
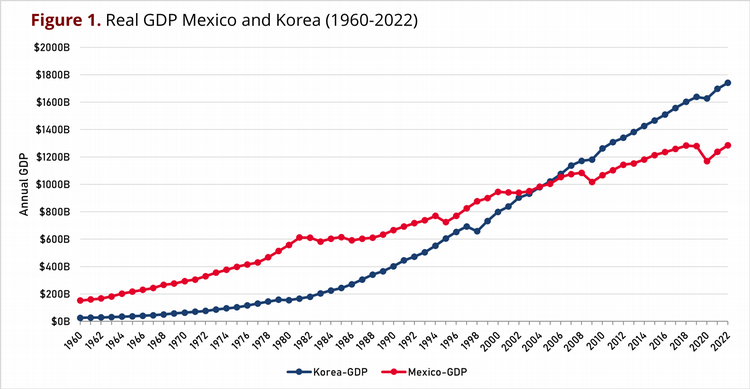
Figure 1 illustrates the real GDP of Mexico and South Korea from 1960 to 2022. In 1960, South Korea’s real GDP was relatively low at $25.7 billion, while Mexico’s was $152.2 billion. South Korea had been through the devastating Korean War that began in June 25 1950 with an invading army descending from North Korea and advancing almost completely through the Korean peninsula before being stopped at Pusan, a city near the southern tip. In the subsequent three years, the United Nations forces drove out the invaders, then faced large setbacks before the lines stabilized near the 38th parallel that had been the border between North Korea and South Korea before the start of hostilities. The armistice ending active combat was agreed to on July 27, 1953. The main point of this brief history is to provide perspective for the situation in South Korea in 1960 just seven years after a devastating war had enveloped the entire area of the country.
Returning to Figure 1, South Korea’s real GDP was one-sixth of Mexico’s real GDP in 1960. But, from 1960 to 1980, South Korea’s real GDP surged by 502%, with an average growth rate of 9% per year, a period marked by Korea’s transition from an agrarian to a more industrialized economy. During this same period, Mexico’s real GDP increased by 266%, with an average annual growth rate of 7%. This was a period of rapid growth in both countries.
Starting in 1980 and continuing to 2005, South Korea’s real GDP grew by 516%, an 8% average annual growth rate, whereas Mexico’s real GDP grew by 64%, a 2% average annual growth rate. Mexico’s growth over this period was only one-eighth the growth rate of South Korea. Such a large decline in Mexico’s economic growth during this period is somewhat unexplained, although contributing factors include the oil crisis in the 1980s and the devaluation of the peso in the 1980s and the 1990s. By 2005, South Korea’s real GDP had reached $1,021.2 billion, surpassing Mexico’s $1,004.1 billion.
Subsequently, from 2005 to 2022, South Korea’s real GDP grew to $1,740.8 billion, a 70.5% increase and an average growth rate of 3.3% per year. In comparison, Mexico’s real GDP grew by 28%, reaching $1,284.9 billion, an average growth rate of 1.5% per year. In 2022, South Korea’s real GDP was 35% higher than Mexico’s real GDP.
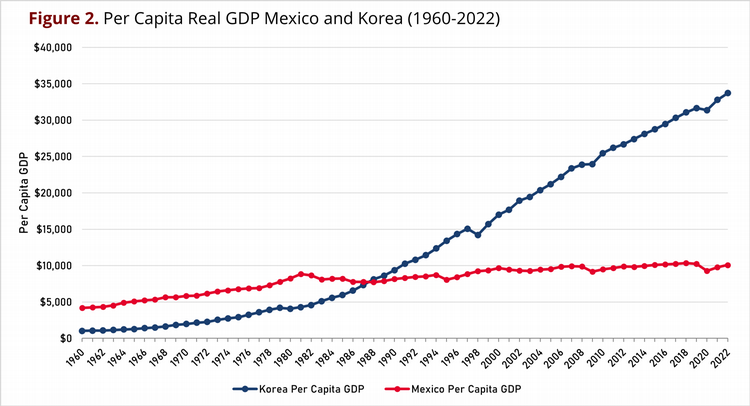
Real GDP increases as a result of both population growth and growth in real GDP per capita. Figure 2 illustrates the trend of per capita real GDP for Korea and Mexico from 1960 to 2022. In 1960, Korea’s per capita real GDP was $1,027, for reasons mentioned above. By comparison, Mexico’s per capita real GDP was four times higher, $4,197.
From 1960 until 1988, Korea’s per capita real GDP grew by an average of 8% annually, reaching $8,120 in 1988. Meanwhile, Mexico’s per capita real GDP had grown by an average of 2% per year, reaching $7,735. That is, 1988 marks the year when per capita real GDP in South Korea first exceeded per capita real GDP in Mexico.
Post-1988, Korea’s per capita real GDP by 2022 soared by 315% to $33,719. In contrast, Mexico’s per capita real GDP increased a modest 32%, to $10,077.
Overall, from 1960 to 2022, Korea’s per capita GDP grew at an average annual rate of 6% while Mexico’s per capita real GDP increased about 1% per year. In Figure 2, from 2000 onward, it is hard to see much of an increase in real GDP per capita for Mexico.
Source: World Bank, World Development Indicators
Both population growth and growth in per capita real GDP are important to understanding growth in total real GDP. But it is also important to account for changes in a nation’s demographics, especially its ratio of working age population to total population. A nation’s output depends on its working population, and one initial measure of labor productivity can be calculated as the ratio of real GDP to working age population.
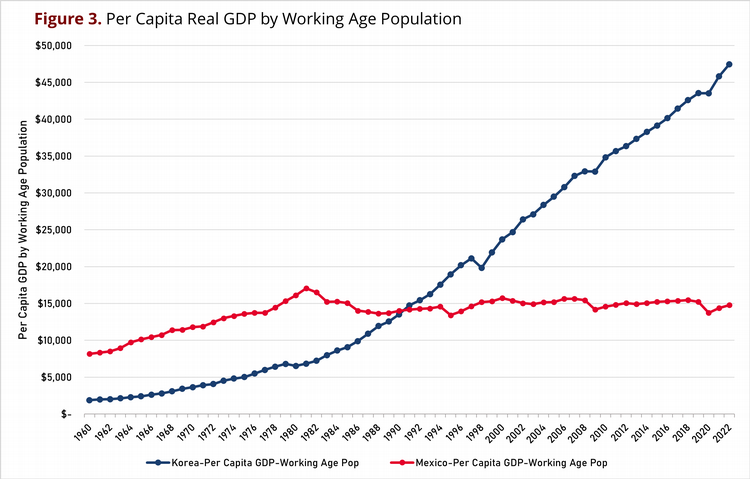
Figure 3 depicts GDP per capita of the working-age population for Mexico and South Korea, also for the period 1960-2022. South Korea’s GDP per working age population shows remarkable and sustained growth. This rapid increase aligns with South Korea’s period of aggressive industrialization and economic reforms, transforming it into a high-income economy. Conversely, Mexico’s real GDP per working age population grew much more gradually, and has been almost flat from the mid 1980’s to the present. Between 1960 and 1980, South Korea’s real GDP per working age population surged by 247%, while Mexico’s increased by 97% and peaked in 1980. From 1980 to 1990, South Korea’s GDP per working age population increased from $6,521 to $13,520, whereas Mexico’s decreased from $16,104 to $14,007. By 1991, South Korea’s GDP per working age population surpassed Mexico’s, increasing from $14,744 in 1991 to $47,467 by 2022, a 221% increase. Meanwhile, Mexico’s GDP per working age population grew modestly, from $14,163 in 1991 to $14,781 in 2022, an increase of only 4% in 31 years.
Source: World Bank, World Development Indicators
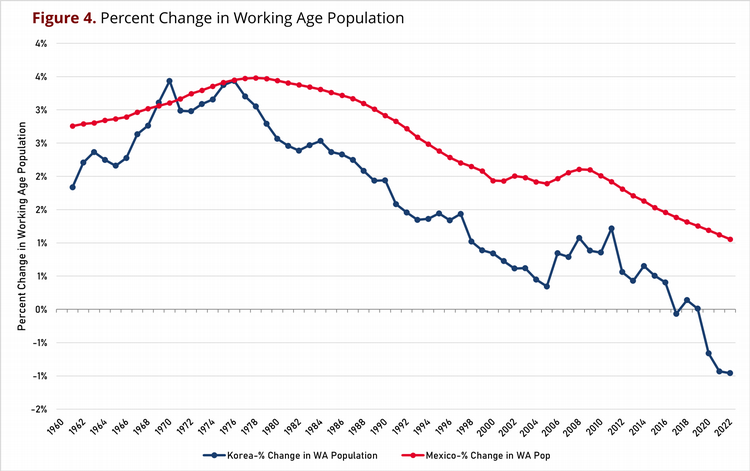
Both South Korea and Mexico have faced declining growth rates of their working age population, as shown in Figure 3. From 1960 to 1980, South Korea experienced a steady increase averaging 2.8% per year, with a peak of 3.4% in 1972 and 1976. However, post-1980, the growth rate began to decline. Between 1980 and 2016, Korea’s working-age population grew at an average rate of 1.2% annually, and from 2016 onwards it saw a negative growth rate of 0.4%, indicating a declining working-age population. This correlates with the decreasing fertility rate in South Korea, which dropped to 0.77 births per woman in 2022, down from 5.94 in 1960.
Mexico’s working-age population also grew positively between 1960 and 1980, with an average growth rate of 3.1%. This growth peaked at about 3.4% in the late 1970s. As in South Korea, Mexico’s growth rate declined post-1980. Fertility rates in Mexico fell to 1.80 in 2022 compared to 6.76 in 1960. Notably, Mexico’s declining growth rate in its working age population has been less pronounced than in South Korea.
Source: Organization for Economic Co-operation and Development, OECD
What factors contribute to the different trajectories of the real GDP per working age population in Mexico and South Korea? While this is not completely understood, commonly cited explanations involve economic policies, governance, education, global integration, and industrial strategies.
South Korea’s proactive and cohesive approach to education has significantly propelled its rapid growth of a skilled workforce. South Korea students earn some of the highest scores of any nation on the OECD’s triennial survey, the Programme for International Student Assessment (PISA). PISA evaluates 15-year-olds’ abilities in reading, mathematics, and science, and in the 2022 PISA assessment, South Korea ranked 5th. Mexico was 56th. Mexico’s challenges in the area of education may in part be responsible for its relatively slow economic advancement.
Another area of emphasis for students of economic growth is a country’s investment in Research and Development (R&D). R&D is recognized as a key driver of economic growth. Numerous studies have demonstrated that increased spending on innovation boosts real GDP per capita. According to data from the World Bank, between 2016 and 2021, Mexico’s R&D expenditure averaged 0.3% of GDP, in stark contrast to South Korea’s 4.6% and the United States’ 3.1%.
Furthermore, an economy’s GDP growth also relies on political stability. The Political Stability Index published by the World Bank includes political stability as one of the Worldwide Governance Indicators. Based on available data, the stability index for Mexico between 1996 and 2022 was a negative 0.6 on average, while for Korea it was a positive 0.4, suggesting a more stable governance structure in Korea.
Harder to measure is the impact of violence related to the drug traffic and cartels, but social stability includes safety and freedom from violence. This too may hold back economic growth and investment in Mexico.
Mexico’s laggardly economic performance is puzzling in part because the North American trade deals (NAFTA in 1993, the USMCS in 2018) were expected to improve Mexico’s growth rates. Some postulate that the emergence of China over this period significantly stifled any large positive impact of these trade deals, but this remains an area of controversy and continued study.
In any case, the diverging economic trajectories of Mexico and South Korea offer a compelling history lesson in how different economies can grow, or fail to grow, over sustained periods of time. A nation far ahead in economic performance may, after many years of substandard growth, find itself falling far behind a comparator nation.
Many years ago Robert Lucas, University of Chicago economics professor and Nobel Laureate, looked at relative economic growth statistics such as those we look at here, and he said the following: “I do not see how one can look at figures like these without seeing them as representing possibilities. Is there some action a government … could take that would lead the … economy to grow [faster]? If so, what, exactly? … The consequences for human welfare involved in questions like these are simply staggering. Once one starts to think about them, it is hard to think about anything else.” {Robert E. Lucas, Jr. “On the Mechanics of Economic Development.” Journal of Monetary Economics 22 (1988), page 5}
__________________________
ENDNOTES
[1] Source: Booth, J. A., & Seligson, M. A. (1984). The Political Culture of Authoritarianism in Mexico: A Reexamination. Latin American Research Review, 19(1), 106–124. http://www.jstor.org/stable/2503299