On May 15, 2024, the Bureau of Labor Statistics (BLS) released data that includes the month of April 2024, our fourth look at the Consumer Price Index (CPI) for 2024. The year-over-year CPI inflation rate came in at 3.4%. The average for the four months of 2024 is 3.3%. These readings remain well above the Fed’s 2% target, and stubbornly above 3%. Equally disappointing is the monthly change in the CPI. The one-month change from March to April was 0.3%, or an annualized rate of 3.8%. The only good thing about this reading is that it is lower than the annualized monthly readings in February and March, but higher than January. As we have repeatedly stated, monthly rates are extremely volatile, and should be looked at with caution. However, the average monthly annualized inflation rate for the first four months of 2024 is 4.4%, significantly above that 2% target.
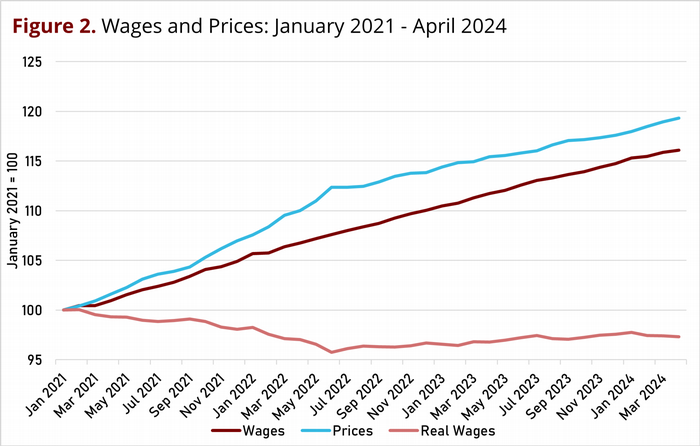
While the ‘Headline’ CPI is designed to measure an average of all prices based on household spending, the ‘Core’ CPI, the CPI Less Food and Energy Prices, excludes a set of prices that are more volatile, ideally to provide a better measure of underlying or more persistent inflation. Some claim that core CPI inflation is a better predictor of future headline inflation. The year-over-year core CPI inflation rate came in at 3.6% in April 2024. There are two trends to note. First, the year-over-year core CPI inflation rates have been declining, almost continuously, since the end of summer 2022. But the speed of this decline has been glacial. Second, the year-over-year core inflation rate has exceeded the year-over-year headline inflation rate every month for the past year. If core inflation is a better indicator of the trend of headline inflation, then the core inflation rate news has not been good news for the Fed.
The monthly annualized core CPI inflation rate for April came in at 3.6%, the lowest monthly reading of 2024. Perhaps that is a glimpse of good news. But monthly readings are volatile. And this reading is still much above 2%.
Figure 1 graphs these inflation rates since January 2021, and the volatility of the monthly (annualized) rates is apparent. It is also clear that by any of the measures the inflation rate is well above the 2% target. In fact, the year-over-year inflation measures have reached something of a plateau that seems to be well above 3%.
Federal Reserve Chair Jerome Powell’s press conference on November 2, 2022 included the following sentences: “We have both the tools that we need and the resolve it will take to restore price stability [i.e., 2% year over year inflation measured by the PCE price index] on behalf of American families and businesses. Price stability is the responsibility of the Federal Reserve…” (See Transcript of Chair Powell's Press Conference -- November 2, 2022 (federalreserve.gov) ; my inserted comment in brackets.) Apparently, the Fed’s job remains a work in progress.
The BLS also released wage data earlier this month and average hourly earnings of all private sector workers increased by 0.2% from March to April, an annualized rate of 2.5%. Year-over-year, wages in April 2024 were 3.9% higher than in April 2023.
It is more important to focus on real wages, i.e., wages adjusted for inflation. An increase in real wages is an increase in the purchasing power of wages. Wages in April were 3.9% higher than a year ago, and prices were 3.4% higher, so real wages rose by 0.1% over the past twelve months. Put differently, the purchasing power of wages has been almost constant over the last year.
Just looking at the one month change from March to April, real wages declined very slightly, as wages rose 0.2% and prices rose 0.3%. The annualized monthly change in the purchasing power of wages from March to April was negative at -0.1%.
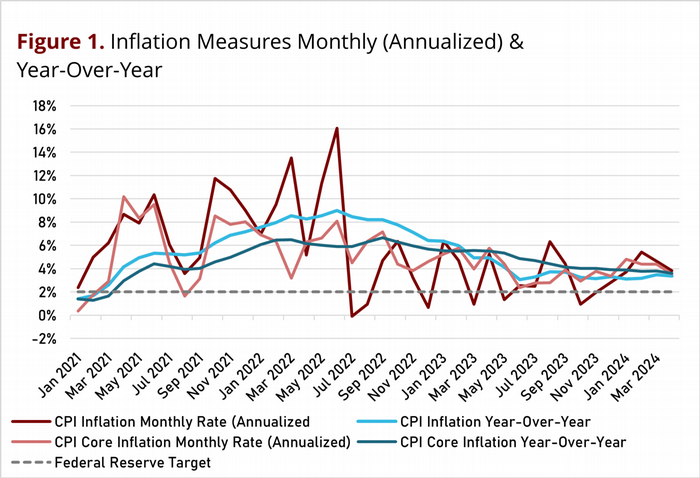
Figure 2 graphs wages, the CPI, and real wages since January 2021. The decline in real wages from January 2021 through June 2022 is shown in the data, as that the CPI grew faster than wages. In June 2022, real wages were 4.2% lower than in January 2021. Since then, the moderation of CPI inflation and the continued growth in wages have led to a period of generally positive but small increases in the purchasing power of wages. However, real wages have shown slight declines in the recent few months. As of March 2024, the purchasing power of wages remains 2.7% lower than in January 2021.