On April 10 2024, the Bureau of Labor Statistics (BLS) released data that includes the month of March, our third look at the Consumer Price Index (CPI) for 2024. The year-over-year CPI inflation rate came in at 3.5%, higher than the 3.1% and 3.2% rates recorded for January and February, respectively. Not only is this rate well above the Fed’s 2% target, it also stubbornly remains above 3%. Perhaps more disappointing is the monthly change in the CPI. The one-month change from February to March was 0.4%, or an annualized rate of 4.6%. As we have repeatedly stated, monthly rates are extremely volatile, and should be looked at with caution. However, the average monthly annualized inflation rate for the first three months of 2024 is 4.6%, well more than double the Fed’s target.
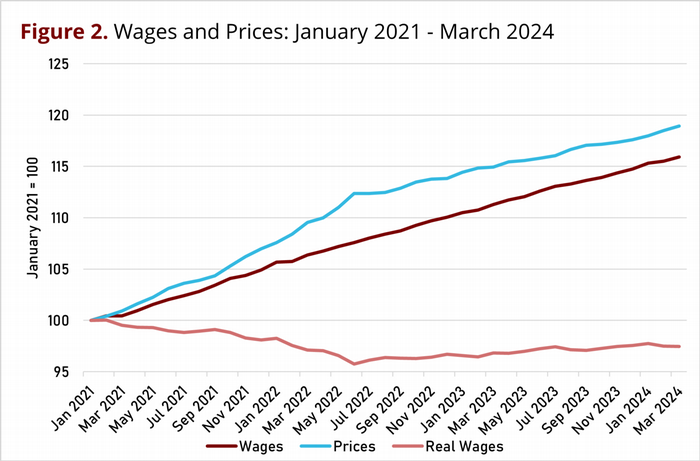
While the ‘Headline’ CPI is designed to measure an average of all prices based on household spending, the ‘Core’ CPI, the CPI Less Food and Energy Prices, excludes a set of prices that are more unstable, ideally to provide a better measure of underlying or more persistent inflation. One claim is that core CPI inflation is a better predictor of future headline inflation. This claim is a matter of debate, but if true, then the persistence of core inflation exceeding headline inflation over the last year is more bad news for the Fed’s ongoing battle against inflation. Core CPI inflation in March came in at 3.8%, and the annualized monthly value came in at 4.4%. The Core CPI year-over-year inflation rate has been higher than the CPI year-over-year measure since early in 2023.
Figure 1 graphs these inflation rates since January 2021, and the volatility of the monthly (annualized) rates is apparent. In fact, the year-over-year inflation measures have reached something of a plateau that seems to be above 3% for headline CPI inflation, and only somewhat below 4% for core CPI inflation.
While the inflation rate is much lower than the historic levels seen in 2021 and in the first half of 2022, it remains stubbornly higher than the Fed’s target level, and has shown some increases in monthly rates this year. Taming inflation is not as easy a task, as we are learning once again.
Federal Reserve Chair Jerome Powell’s press conference on November 2, 2022 included the following sentences: “We have both the tools that we need and the resolve it will take to restore price stability [i.e. 2% year over year inflation measured by the PCE price index] on behalf of American families and businesses. Price stability is the responsibility of the Federal Reserve…” (See Transcript of Chair Powell's Press Conference -- November 2, 2022 (federalreserve.gov) ; my inserted comment in brackets.) Seventeen months later, the job remains a work in progress. One might well wish that the work had started earlier, instead of claiming the inflation problem was transitory and did not require a Fed response. One might even wish that the Fed had not, in August 2020, abandoned its previous policy of preemptively moving against incipient inflation, to better avoid inflation getting started.
The BLS also released wage data earlier this month and average hourly earnings of all private sector workers increased by 0.4% from February to March, an annualized rate of 4.3%. Year-over-year, wages in March 2024 were 4.1% higher than in March 2023.
It is more important to focus on real wages, i.e., wages adjusted for inflation. An increase in real wages is an increase in the purchasing power of wages. Wages in March were 4.1% higher than a year ago, and prices were 3.5% higher, so real wages rose by 0.7% over the past year. This continues a long period of gradually increasing real wages that began in summer 2022.
Just looking at the one month change from February to March, real wages declined very slightly, as wages rose 0.4% and prices rose 0.4%. The annualized monthly change in the purchasing power of wages from February to March was just slightly negative, -0.03%.
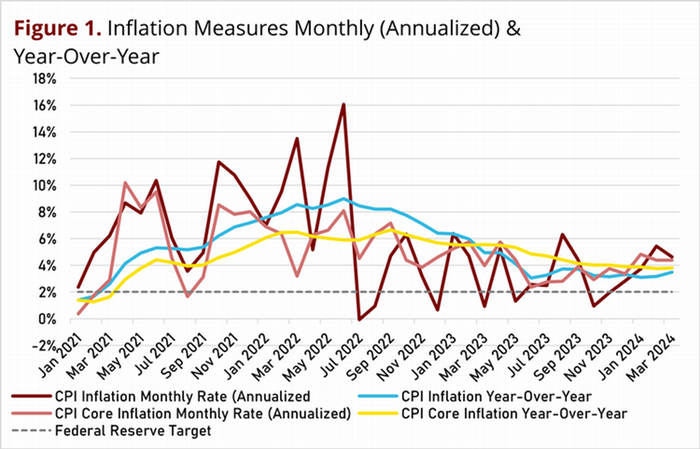
Figure 2 graphs wages, the CPI, and real wages since January 2021. The decline in real wages from January 2021 through March 2024 is shown in the data, as the CPI grew faster than wages. In June 2022, the lowest point during this period, real wages were 4.2% lower than in January 2021. Since then, the moderation of CPI inflation and the continued growth in wages have led to a period of generally positive but small increases in the purchasing power of wages. However, real wages have shown slight declines in the recent few months. As of March 2024, the purchasing power of wages remains 2.6% lower than in January 2021.