We are in the 37th month of President Biden’s term in office, a period marked by a spell of high inflation and wages not keeping up with inflation. PERC has provided monthly blogs to chronical the inflation experience during this time, and the decline in the purchasing power of wages. Inflation is measured by changes in the Consumer Price Index, or CPI. Inflation-adjusted wages, what economists label ‘real wages,’ are changes in average hourly earnings minus changes in the CPI.
Here, we describe the experience with inflation and real wages during past presidential administrations. Each administration term runs from January of their initial year until January of their 48th month. For instance, President Carter was inaugurated in January 1977, and his term in office ended in January 1981, when President Reagan was inaugurated. President Reagan served two terms, until January 1989, when he was replaced by President George Herbert Walker Bush. And so on.
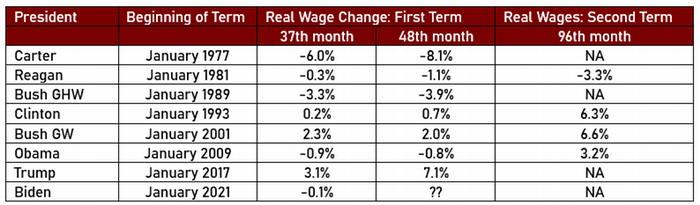
Below, we provide the change in the CPI in Table 1, and change in real wages in Table 2, from each president’s inauguration until the end of their first term, their 48th month in office, and if applicable, to the end of their second term, their 96th month in office. Because our last data point for President Biden is January 2024, his 37th month in office, we also provide for each president information on the change in the price level and in real wages from their inauguration date through their 37th month in office.
President Carter had the worst experience with the price level, and the worst experience with real wages. His term in office began in January 1977. The economy experienced a recession from January 1980 until July 1980. It also experienced high inflation, and the combination of recession and inflation earned the label stagflation. By his 37th month, the price level had risen 32.9%, and real wages had declined 6.0%. By the end of his term, prices had risen 48.6%, and real wages had declined 8.1%. President Carter was not elected for a second term.
President Reagan began his first term in January 1981 and he was greeted by a recession that lasted from July 1981 through November 1982, a recession largely credited to the Federal Reserve System and its actions to reduce money supply growth and thereby increase the monetary policy interest rates in an effort to reduce the high inflation rate. By his 37th month in office, the price level had increased 17.1%, a slowdown from the previous administration but still a high level, and real wages were down 0.3%. By the end of his first term, the price level had risen 21.2% and real wages had declined 1.1%. By the end of his second term, the price level had risen by 39.0% and real wages had declined by 3.3%.
Present George H. W. Bush followed President Reagan in January 1989. The economy experienced a recession from July 1990 through March 1991. The price level rose by 14.1%, and real wages declined 3.3%, by President Bush’s 37th month. By his 48th month, prices had risen 17.8% and real wages had declined 3.9%. He did not receive a second term.
President Clinton was inaugurated in January 1993 and experienced an eight-year term without a recession. By his 37th month in office prices had risen 8.3%, and real wages had risen 0.2%. By his 48th month, the price level had risen by 11.6% and real wages had risen 0.7%. During his second term, the price level increased to be 23% higher than when he was first inaugurated in January 1993. Real wages rose quickly in President Clinton’s second term, and by the end of his second term real wages had risen 6.3% during his time in office.
President George W. Bush took office in January 2001 and immediately dealt with a recession from March 2001-November 2001. During his first term, the price level increased by 9.1% during his first 48 months, and real wages increased 2.0%. By the end of his second term, the price level had risen by 20.7% and real wages were up 6.6%. The end of President George W. Bush’s second term was marked by the global financial crisis and another downturn in economic activity, a lengthy period labeled the Great Recession, from December 2007 through June 2009.
President Obama was inaugurated in January 2009 in the midst of the Great Recession. During President Obama’s first term, the price level increased 9.3%, and real wages declined by 0.8%. In his second term, real wages increased, and by his 96th month in office real wages had grown 3.2% above their level when he was inaugurated in January 2009. Over his two terms, prices rose 15.0%.
President Trump succeeded President Obama in January 2017, and experienced low inflation and strong increases in real wages. During his single term the economy was struck by the COVID epidemic, and the economy suffered through the Pandemic Recession from February 2020 through April 2020. This was a relatively brief but intense decline in economic activity. By his 37th month in office, January 2020, immediately prior to the Pandemic Recession, prices had risen 6.3% and real wages had increased 3.1%. For all presidential terms we examine at their 37th month, President Trump had the second lowest increase in prices, and the highest increase in real wages. The Pandemic Recession that began immediately thereafter had many impacts on the economy, including soaring unemployment but continued low inflation. The official wage and price data indicates that prices rose by 7.8%, and real wages increased by 7.1%, by the end of President Trump’s term in office. Of note, part of that large increase in real wages was due to compositional effects as lower-wage workers were laid off during the Pandemic Recession, so that the average monthly wage of those continuing to work was calculated over a set of workers who tended to be higher-income workers. President Trump did not receive a second term.
President Biden took office in January 2021, and while the Pandemic Recession was officially over and the recovery underway, the unemployment rate was still elevated. By the time of this post and the data available for January 2024, prices were 18% above the level at inauguration, and real wages were a scant 0.1% lower in January 2024 compared to January 2021. Time will tell how prices, and real wages, will look in January 2025, his 48th month in office.
Table 1. Changes in the Price Level
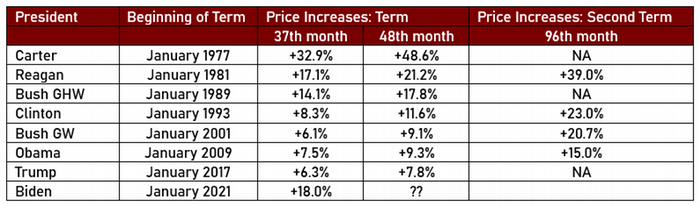
Table 2. Inflation-Adjusted Changes in Wages
Source: Wage and price data is from the BLS. Wages are average hourly earnings of production workers. Prices are the CPI-U. Real wages are wages divided by price. Percentage increases or decreases in real wages from the beginning of term until the indicated month are calculated by PERC.
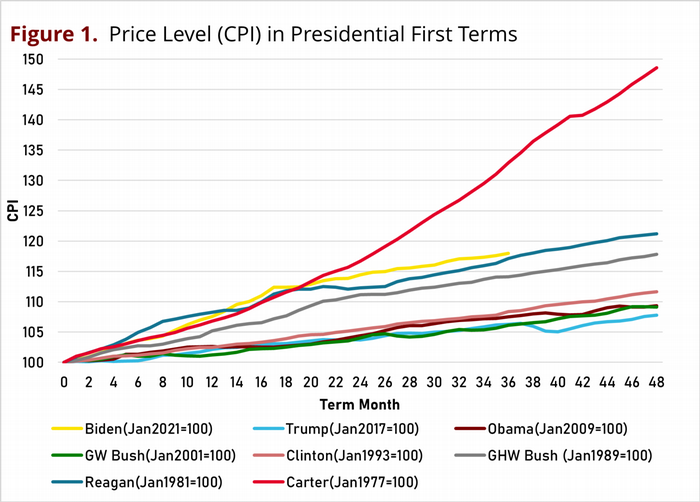
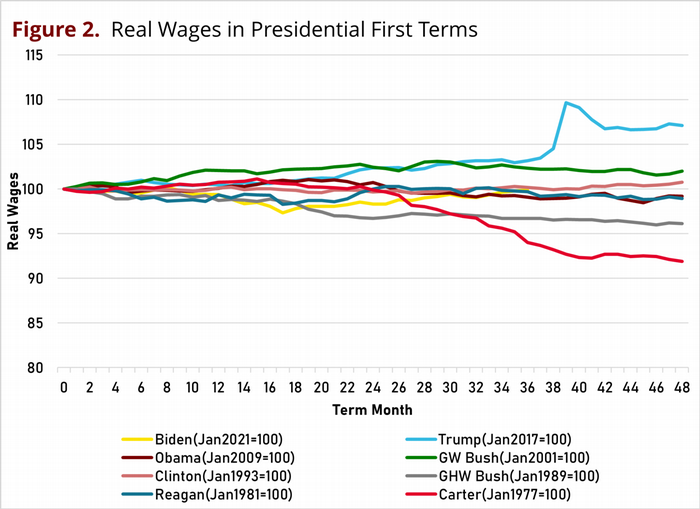
The two graphs plots the monthly path of the price level and of real wages for the first term of each president in our list. The paths vary, and can be partially explained by various events during their various terms in office.
Figure 1 plots the price level during each president’s first term. The months are number from 1 (the inauguration, January 1977 for President Carter) to 49 (the end of term, January 1981 for President Carter). The price level is normalized to 100 at the inauguration month, and changes over time occur at each month of the presidential term. In Figure 1, it is clear that President Carter experienced the largest inflation by far, with prices rising almost 50% during his term in office. The second and third highest inflation rates were experienced by President Reagan and President GHW Bush, respectively.
For some perspective, the US experienced high inflation rates in the 1970s and 1980s, the peak reached during President Carter’s time in office. During President Reagan’s time in office the Federal Reserve System, with approval from the White House, acted to reduce the inflation. The inflation rate was gradually reduced, over many years. From Table 1, the inflation rate fell from 48.6% in Carter’s first term to 21.2% in Reagan’s first term to 17.8% in GHW Bush’s first term to 11.6% in Clinton’s first term to 9.1% in GW Bush’s first term. To put this in some perspective, the Federal Reserve System unofficially adopted a loose 2% inflation target in about 1996, during Clinton’s presidential terms, and officially adopted a 2% inflation target in January 2012, during Obama’s presidential term. A 2% annual inflation target would yield an inflation rate of 8.2% in four years, and starting with GW Bush’s presidency, inflation rates were near that number right up until President Biden. An interpretation is that inflation reduction took a long time, was largely achieved so that the Fed was comfortable working with an unofficial 2% target starting in the Clinton years, and continued in that arrangement right up through the Trump years.
Looking again at Figure 1, we see that the path of prices during President Biden’s term has been, through month 37, second only to President Carter in the extent of price level rise, of inflation. This is the big deviation in the path of inflation compared to all other presidencies back to the middle 1990s. The FRB was slow to respond to inflation, initially labeled it transitory and delayed removing that label and delayed taking action against inflation even after acknowledging that it was more than transitory. The inflation rate, the rise in the CPI, during the first 37 months of President Biden’s time in office has been worse than any of the presidential terms listed here except President Carter.
The presidents from Clinton to Trump are in a group at the bottom of the graph, and fall in a fairly narrow range of experiences. If anything, the final year President Trump’s term has the lowest inflation path. This happened during the Pandemic Recession and its aftermath, when the CPI actually declined for several months.
The next figure, Figure 2, plots real wages over the first term of the presidencies we examine. The rather large declines of real wages during the terms of President Carter and President George H.W. Bush are rather striking. This may partly explain their failure to be reelected to a second term. The second and perhaps more striking feature is the high rate of real wage growth during President Trump’s time in office. The large spike in April is due in part to the Pandemic Recession and the fact that lower-wage workers (including restaurant and hotel workers) were much more likely to be laid off during that recession due to COVID and the government-ordered restrictions and shutdowns in response to the pandemic. With these workers laid off and not being paid, the wage data for remaining workers included a disproportionate number of higher wage workers, causing the average to rise. This selection effect is an outlier due to a rare event, the black swan type event that was COVID-19. However, even before the recession, real wage growth during President Trump’s term was, even in his 37th month, higher than any of the other presidents. Only President George W. Bush comes close to President Trump’s 37th month mark.