
Real Gross Domestic Product (GDP) is often used as a measure of economic prosperity. GDP measures the dollar value of all finished (or final) goods and services produced in an economy over a specified timespan, usually a year or a quarter of a year. Here we use annual data. Finished goods and services are those ready for final use by consumers, businesses, or government. Finally, real GDP removes any increase in dollar values that occur strictly due to price increases, so that real GDP measures the increase in production of goods and services and not increases in dollar values due to inflation.
With last December’s release of GDP numbers by the Bureau of Economic Analysis (BEA), the top five states – which contribute 41% of the total U.S. GDP in 2022 – were California, Texas, New York, Florida, and Illinois, in that order. Figure 1 shows the real GDP for these states in trillions of dollars.
Size matters. For a given level of gross domestic product per person, larger states have larger levels of GDP. That means that larger states – larger in population – have a leg up in the GDP rankings. But productivity also matters. Real GDP per person, real GDP per capita, is one way to think about productivity. In a sense it provides a measure of average productivity per person. For two states with the same population, the state with higher real GDP per person will have a larger real GDP.
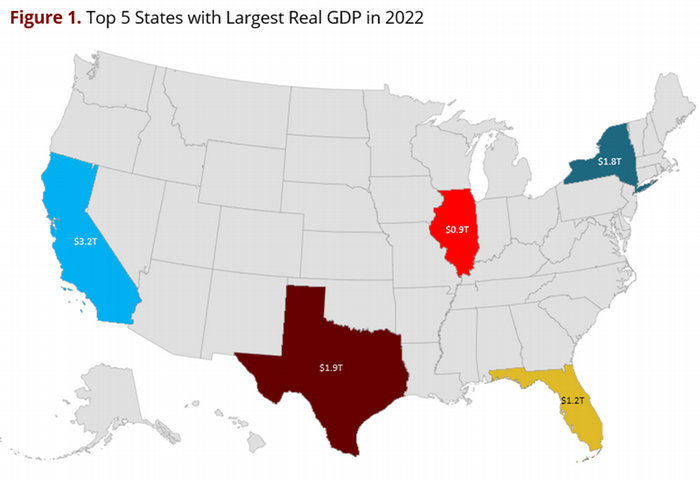
Industry structure also matters. In 2022, California’s large real GDP of $3.2T was driven mainly by the Real Estate and the Professional and Scientific industries, i.e. Silicon Valley. Texas had the second highest real GDP of $1.9T, with its Energy industry contributing the largest share of GDP, followed by Manufacturing and then by Real Estate. New York ranked third in overall real GDP, with its Finance and Insurance industry contributing the largest share of GDP. Florida contributed $1.2T of the U.S. GDP in 2022, with its Tourism and its Real Estate industries leading the way. Illinois ranked fifth, with a large share of GDP from its Manufacturing industry.
Population and Real GDP
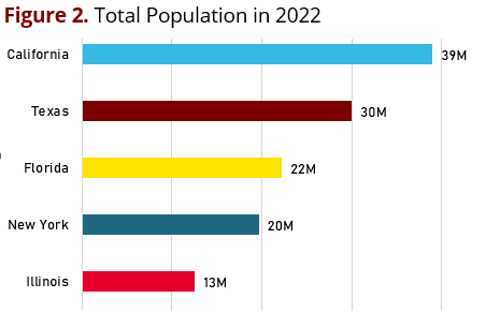
Real GDP and population size are positively correlated; more people produce more output. In 2022, California recorded the highest population at 39 million residents, followed by Texas at 30 million, Florida at 22 million, New York at 19 million, and Illinois in fifth with 12 million residents. Figure 2 graphs the 2022 annual population for these five states. The rank order of these states by population was the same from 2017 to 2022.
Real GDP Per Capita
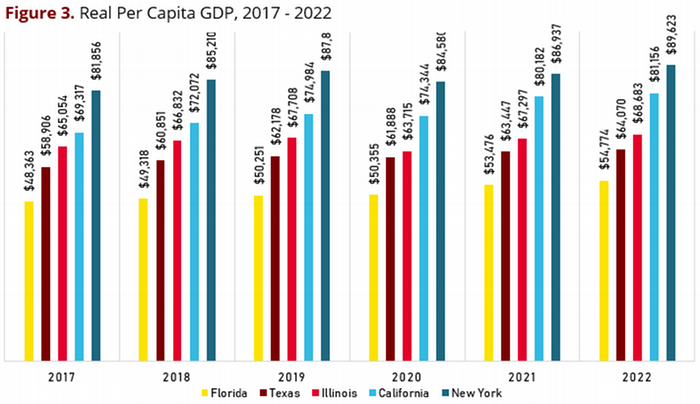
Real GDP per capita goes a step further and divides real GDP by population, so real GDP per capita measures the inflation-adjusted value of production of finished goods and services per person. For per capita GDP, only two of the above states ranked in the top five in 2022: New York was first, followed by Massachusetts, then Washington, while California ranked fourth. The two states ranked 49th and 50th in per capita GDP were West Virginia and Mississippi, respectively. Figure 3 reports the per capita GDP of California, Florida, Illinois, New York and Texas over time from 2017-2022.
Working Age and Real GDP
Although a state may have a large total population, not all state residents work, or produce finished goods and services that contribute to GDP. To get a clearer picture of the efficiency of the actual labor force, we examine the working age population, defined by the Bureau of Labor Statistics (BLS) as those aged 16 - 63. Those under 16 are considered to be students (as schooling is mandatory up to age 16), and those over 63 are retired or nearing retirement. The per-capita GDP by working age population over the time span 2017-2022 for our set of states is graphed in Figure 4.
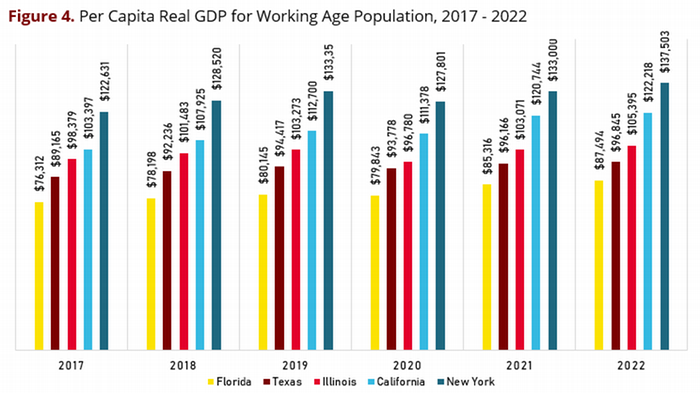
On average, about 66% of the total population in these states are considered to be the working age population. Interestingly, Texas is the only state in this group with a rising working age proportion. In Texas, the number of employers and the number of employees increased. Florida’s working age proportion was lower than many other states because Florida is the destination of choice for many retirees. Spending those golden years in the sunshine state is a goal shared by many, and the lack of a state income tax in Florida (and in Texas) just sweetens the pot. However, for Florida this means that it has a relatively low working age population relative to total population.
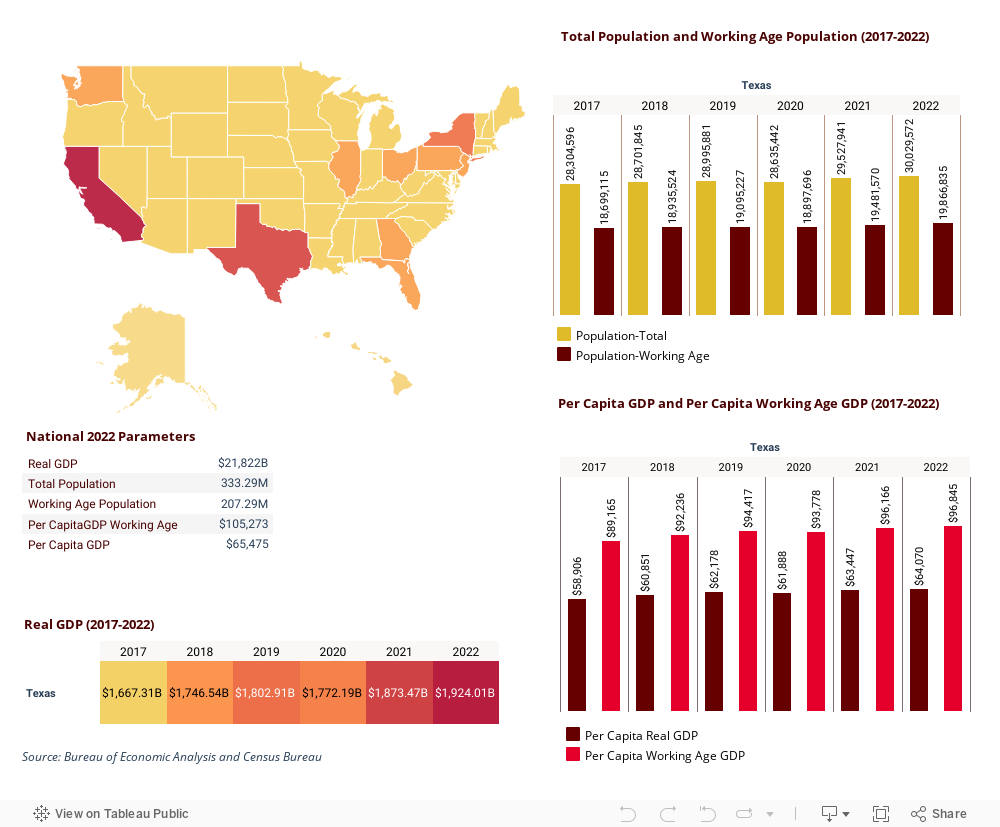
The dashboard below gives a more detailed view of each state’s real GDP, per capita GDP by total population and per capita GDP by working age population, from 2017-2022. By hovering over each state in the map, the state’s real GDP, per capita real GDP, and the per capita real GDP for the working-age population is visible for the year 2022. For the chosen state, the two dynamic bar charts on the right show the trends of the total population, working age population, and per capita GDP by total population and by working age population for the chosen state. The map is color coded with the real GDP numbers for 2022. The darker shades have high real GDP compared to the lighter shades. Below the map is a table for national parameters for 2022, for comparison to the state numbers. Last but not the least, a table shows the real GDP from 2017-2022 for each selected state.
States with large populations and metro centers tend to have higher real GDP. In 2022, California had the highest real GDP at $3.2 trillion and the largest population at 39 million residents. Texas ranked second in both real GDP and population with $1.9 trillion and 30 million residents. Although Florida ranked third in total population with 22 million residents, New York ranked third in real GDP with $1.8 trillion compared to Florida’s $1.2 trillion. About the same proportion of total residents fell within the working age population for each of these five states, but New York outstripped the other states by a large margin when looking at the GDP per worker, or per capita real GDP for the working age population.