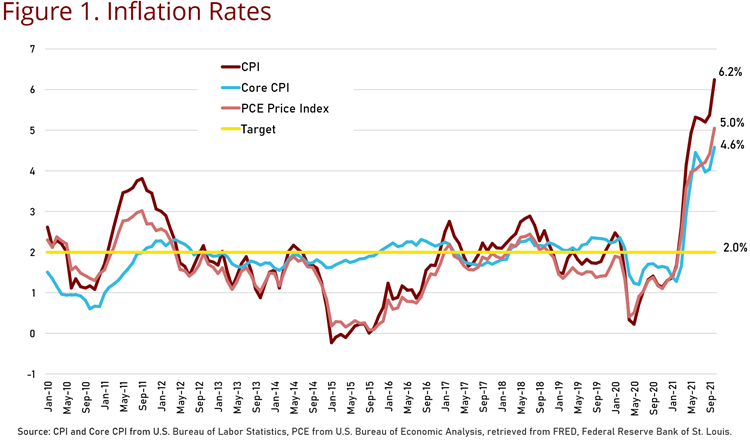
'Transitory' is the adjective used by the Federal Reserve System to describe the recent rise in inflation. Regardless of the inflation measure, since May, inflation has been higher than it has been since 2010, as seen in Figure 1. The consumer price index (CPI) rose 6.2% between October 2020 and October 2021 and the index that excludes food and energy prices, the Core CPI rose 4.6%. The broader measure of inflation based on personal consumption expenditures (PCE) rose 5.0%. All of these are well above the Federal Reserves long-run target of 2% inflation.

Make no mistake; these are high inflation rates. According to the Bureau of Economic Analysis, the PCE price index inflation rate in October, at 5.0%, is the highest monthly year-over-year inflation rate as measured by this price index since November 1990, when it was 5.1%. The CPI inflation rate at 6.2% is the highest year-over-year CPI inflation rate since December 1990, when it was 6.3%. The Federal Reserve System announced in August of 2020 that it was adopting average inflation rate targeting they said this meant that "following periods when inflation has been running persistently below 2 percent, appropriate monetary policy will likely aim to achieve inflation moderately above 2 percent for some time." Few probably interpreted that inflation rates 'moderately above 2 percent' meant allowing inflation to climb to a three-decade high. Depending on how long this high inflation lasts, we may also learn more about what was meant by "for some time."
The current bout of inflation is driven by supply disruptions and increased demand bolstered by the influx of pandemic relief funds. The idea behind transitory inflation is that once the supply-chain issues settle out, and consumers spend their extra cash, the inflation rate will return to its long-run expected rate.
On the supply side, we all can see the bottlenecks at some ports as reported in the news, the few new vehicles at car dealerships, the letters in the mail offering to buy your current vehicle at a premium, short-staffed restaurants, and a limited or sporadic assortment of products at the grocery store. Shortages of all types of products at the beginning of the COVID recession were expected, but while many of the products that were in short supply at the beginning of the pandemic are now plentiful, some shortages have lingered, and new ones have appeared. Stories abound about shortages in the semiconductor, lumber, gas, and consumer durable markets. The producer price index for final demand rose 8.6% between October 2020 and October 2021.
At the same time, when we walk into many establishments, be they restaurants, grocery stores, or retail businesses, a "now hiring" sign announces the starting wage and other benefits. These starting wages are well above the federal minimum. The number of workers on nonfarm payrolls in October was 4.2 million fewer than at the pre-pandemic high in February 2020, but in September there were 10.4 million jobs available. Combined with increases in other input prices, it's no surprise that, due to supply side effects alone, prices are going up.
The demand side of the equation has compounded the price level increases due to constrained supply. Demand has increased substantially as Americans spend stimulus funds provided through the Paycheck Protection Program, two rounds of stimulus checks, child tax credits, and extended and supplemented unemployment checks. These were necessary during the recession given the lockdowns, but the lockdowns disrupted the supply of both goods and services. Demand was constrained for a time at the outset of the pandemic, but potential demand was building as savings rose. Additionally, while some workers have not returned to the workforce, average wages actually rose 2.83% between 2019 and 2020, measured by the Social Security national average wage index.
This increase in demand and reduction in supply that has led to higher prices may indeed be transitory, as some have suggested, and others are hoping. Last month's Federal Reserve Federal Open Market Committee (FOMC) statement, released November 3, stated that "Inflation is elevated, largely reflecting factors that are expected to be transitory." In testimony before the Committee on Banking, Housing and Urban Affairs, Federal Reserve Chair Jerome Powell provided additional nuance on Fed views of the extent of the transitory inflation expectation. In that testimony he stated, "Most forecasters, including the Fed, continue to expect that inflation will move down significantly over the next year as supply and demand imbalances abate. It is difficult to predict the persistence and effects of supply constraints, but it now appears that factors pushing inflation upward will linger well into the next year." This statement seems to acknowledge that the Fed's control of inflation is somewhat tenuous, and that their phrase 'for some time' is, at the very least, many months.
One item of concern is the increase in wages, usually a good thing if it occurs due to productivity increases. Wages are increasing, at least partly in response to price increases (i.e. inflation). Wage increases will raise costs and lead to further price increases for goods and services. In addition, unlike supply chain bottlenecks and one-time stimulus funds, wage increases are not transitory. Economists have long built the concept of 'downward wage rigidity' into their models. The rise in wages has permanently increased costs. To the extent that this raises prices over time as businesses respond to the increase in costs, these wage increases help inflation persist. Moreover, there is the possibility of a vicious cycle, as price increases may lead to additional wage increases.
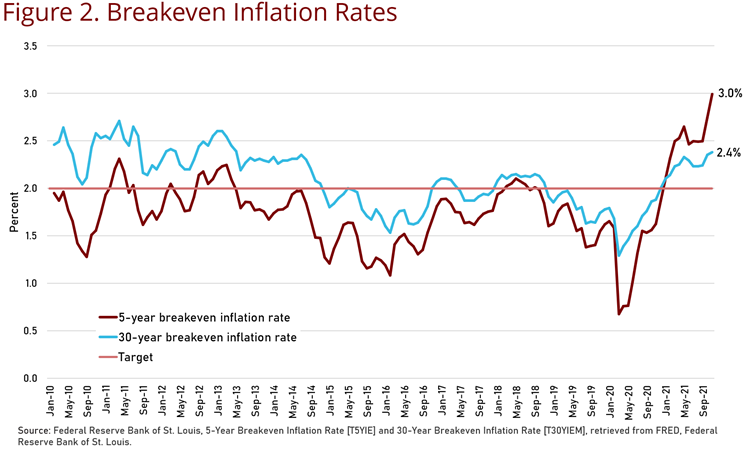
Based on this last FOMC statement, the Fed is expecting higher inflation to persist through much of the next year. One convenient way to gauge how the market assesses the persistence of inflation is by comparing constant maturity Treasury securities to inflation-indexed constant maturity Treasuries of the same term. The derived inflation rate from this comparison, called the breakeven inflation rate, provides an indication of how the market assesses the inflation rate over the time period in question.
Figure 2 presents the breakeven inflation rates over the next 5 years and over the next 30 years. Note that the shorter term 5-year breakeven rate was both lower than the 2.0% target rate for much of the period and was below the longer-term 30-year rate until February of this year. Since February, the 5-year breakeven rate has exceeded the 30-year rate, indicating the market sees the current higher inflation rate as transitory, but the question remains, how long is 'transitory?'
To arrive at the 3% 5-year breakeven rate requires rates above the Fed's target rate to persist for the next three years. For example, assuming a 5% rate to the coming year, 3.5% in 2023, 2.5% in 2024 and then 2% for the last two years produces the 3.0% breakeven rate. But, persistently higher than target rates for three years have not been seen over the last decade.

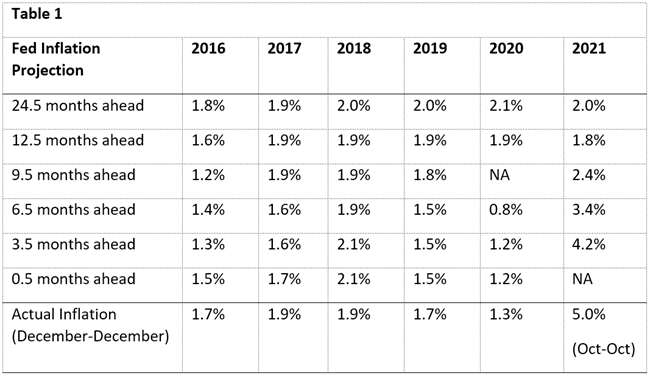
Finally, each quarter the Federal Reserve provides economic projections of various economic variables including projections of the expected inflation rate for the current year, each of the next three years, and a longer run estimate. Table 1 summarizes the Fed's projection for the periods ending in the years listed on the top row using December projection of a year past as the starting point. For example, consider 2016: the Fed's projection of the inflation rate for 2016 made in December 2014, so 24.5 months before the end of 2016, was 1.8%. This projection was revised in December 2015, 12.5 months before the end of 2016, to 1.6%. Then in March of 2016, the Fed projection the 2016 inflation rate to be 1.2%. In June, just 6.5 months before the end of 2016, the Fed projection was revised to 1.4%. Then in September, just 3.5 months before the end of the year, the Fed projection was again revised to 1.3%. Finally, in December 2016, just one-half month before the end of the year, the Fed projection for the 2016 inflation rate was revised to be 1.5%. The actual 2016 inflation rate, December 2015 to December 2016, was 1.7%.

For 2021, the 24.5 month ahead projection was 2.0%, equal to the Fed's inflation target. (Note that most long term projections are near the 2.0% target.) The 12.5 month-ahead projection was 1.8%. The March 2021 projection, for 2021, was 2.4%. The June projection was 3.4%. The September projection was 4.2%. The December projection is not yet available, nor is the final 2021 value of the actual inflation rate. But the October year-over-year inflation rate was 5.0%. Basically, the Fed didn't think the inflation rate would be anywhere near this high even in March of this year. It was only as the Fed observed rising inflation rates that it, gradually, began adjusting its projection upward.
In September 2021, what was the Fed telling us about its view of future inflation beyond 2021? The Fed announced that it expected inflation to be 2.2% for 2022, to remain at that level in 2023, and to decline to 2.1% in 2024. The Fed seems more optimistic about the rate at which the inflation rates return to the target rate than the path implied by the breakeven rates from the bond market. Then again, Chairman Powell's most recent pronouncements, quoted above, may indicate that the Fed has again altered its projections in the last couple months, so that the December projections for 2023 will be above 2.2%. We will see. But one thing is clear; inflation is hard to project, even for the Fed. It may well be that the Fed will find it harder to get inflation back to its 2% target than it would like us to believe.
Make no mistake; these are high inflation rates. According to the Bureau of Economic Analysis, the PCE price index inflation rate in October, at 5.0%, is the highest monthly year-over-year inflation rate as measured by this price index since November 1990, when it was 5.1%. The CPI inflation rate at 6.2% is the highest year-over-year CPI inflation rate since December 1990, when it was 6.3%. The Federal Reserve System announced in August of 2020 that it was adopting average inflation rate targeting they said this meant that "following periods when inflation has been running persistently below 2 percent, appropriate monetary policy will likely aim to achieve inflation moderately above 2 percent for some time." Few probably interpreted that inflation rates 'moderately above 2 percent' meant allowing inflation to climb to a three-decade high. Depending on how long this high inflation lasts, we may also learn more about what was meant by "for some time."
The current bout of inflation is driven by supply disruptions and increased demand bolstered by the influx of pandemic relief funds. The idea behind transitory inflation is that once the supply-chain issues settle out, and consumers spend their extra cash, the inflation rate will return to its long-run expected rate.
On the supply side, we all can see the bottlenecks at some ports as reported in the news, the few new vehicles at car dealerships, the letters in the mail offering to buy your current vehicle at a premium, short-staffed restaurants, and a limited or sporadic assortment of products at the grocery store. Shortages of all types of products at the beginning of the COVID recession were expected, but while many of the products that were in short supply at the beginning of the pandemic are now plentiful, some shortages have lingered, and new ones have appeared. Stories abound about shortages in the semiconductor, lumber, gas, and consumer durable markets. The producer price index for final demand rose 8.6% between October 2020 and October 2021.
At the same time, when we walk into many establishments, be they restaurants, grocery stores, or retail businesses, a "now hiring" sign announces the starting wage and other benefits. These starting wages are well above the federal minimum. The number of workers on nonfarm payrolls in October was 4.2 million fewer than at the pre-pandemic high in February 2020, but in September there were 10.4 million jobs available. Combined with increases in other input prices, it's no surprise that, due to supply side effects alone, prices are going up.
The demand side of the equation has compounded the price level increases due to constrained supply. Demand has increased substantially as Americans spend stimulus funds provided through the Paycheck Protection Program, two rounds of stimulus checks, child tax credits, and extended and supplemented unemployment checks. These were necessary during the recession given the lockdowns, but the lockdowns disrupted the supply of both goods and services. Demand was constrained for a time at the outset of the pandemic, but potential demand was building as savings rose. Additionally, while some workers have not returned to the workforce, average wages actually rose 2.83% between 2019 and 2020, measured by the Social Security national average wage index.
This increase in demand and reduction in supply that has led to higher prices may indeed be transitory, as some have suggested, and others are hoping. Last month's Federal Reserve Federal Open Market Committee (FOMC) statement, released November 3, stated that "Inflation is elevated, largely reflecting factors that are expected to be transitory." In testimony before the Committee on Banking, Housing and Urban Affairs, Federal Reserve Chair Jerome Powell provided additional nuance on Fed views of the extent of the transitory inflation expectation. In that testimony he stated, "Most forecasters, including the Fed, continue to expect that inflation will move down significantly over the next year as supply and demand imbalances abate. It is difficult to predict the persistence and effects of supply constraints, but it now appears that factors pushing inflation upward will linger well into the next year." This statement seems to acknowledge that the Fed's control of inflation is somewhat tenuous, and that their phrase 'for some time' is, at the very least, many months.
One item of concern is the increase in wages, usually a good thing if it occurs due to productivity increases. Wages are increasing, at least partly in response to price increases (i.e. inflation). Wage increases will raise costs and lead to further price increases for goods and services. In addition, unlike supply chain bottlenecks and one-time stimulus funds, wage increases are not transitory. Economists have long built the concept of 'downward wage rigidity' into their models. The rise in wages has permanently increased costs. To the extent that this raises prices over time as businesses respond to the increase in costs, these wage increases help inflation persist. Moreover, there is the possibility of a vicious cycle, as price increases may lead to additional wage increases.
Based on this last FOMC statement, the Fed is expecting higher inflation to persist through much of the next year. One convenient way to gauge how the market assesses the persistence of inflation is by comparing constant maturity Treasury securities to inflation-indexed constant maturity Treasuries of the same term. The derived inflation rate from this comparison, called the breakeven inflation rate, provides an indication of how the market assesses the inflation rate over the time period in question.
Figure 2 presents the breakeven inflation rates over the next 5 years and over the next 30 years. Note that the shorter term 5-year breakeven rate was both lower than the 2.0% target rate for much of the period and was below the longer-term 30-year rate until February of this year. Since February, the 5-year breakeven rate has exceeded the 30-year rate, indicating the market sees the current higher inflation rate as transitory, but the question remains, how long is 'transitory?'
To arrive at the 3% 5-year breakeven rate requires rates above the Fed's target rate to persist for the next three years. For example, assuming a 5% rate to the coming year, 3.5% in 2023, 2.5% in 2024 and then 2% for the last two years produces the 3.0% breakeven rate. But, persistently higher than target rates for three years have not been seen over the last decade.
Finally, each quarter the Federal Reserve provides economic projections of various economic variables including projections of the expected inflation rate for the current year, each of the next three years, and a longer run estimate. Table 1 summarizes the Fed's projection for the periods ending in the years listed on the top row using December projection of a year past as the starting point. For example, consider 2016: the Fed's projection of the inflation rate for 2016 made in December 2014, so 24.5 months before the end of 2016, was 1.8%. This projection was revised in December 2015, 12.5 months before the end of 2016, to 1.6%. Then in March of 2016, the Fed projection the 2016 inflation rate to be 1.2%. In June, just 6.5 months before the end of 2016, the Fed projection was revised to 1.4%. Then in September, just 3.5 months before the end of the year, the Fed projection was again revised to 1.3%. Finally, in December 2016, just one-half month before the end of the year, the Fed projection for the 2016 inflation rate was revised to be 1.5%. The actual 2016 inflation rate, December 2015 to December 2016, was 1.7%.
For 2021, the 24.5 month ahead projection was 2.0%, equal to the Fed's inflation target. (Note that most long term projections are near the 2.0% target.) The 12.5 month-ahead projection was 1.8%. The March 2021 projection, for 2021, was 2.4%. The June projection was 3.4%. The September projection was 4.2%. The December projection is not yet available, nor is the final 2021 value of the actual inflation rate. But the October year-over-year inflation rate was 5.0%. Basically, the Fed didn't think the inflation rate would be anywhere near this high even in March of this year. It was only as the Fed observed rising inflation rates that it, gradually, began adjusting its projection upward.
In September 2021, what was the Fed telling us about its view of future inflation beyond 2021? The Fed announced that it expected inflation to be 2.2% for 2022, to remain at that level in 2023, and to decline to 2.1% in 2024. The Fed seems more optimistic about the rate at which the inflation rates return to the target rate than the path implied by the breakeven rates from the bond market. Then again, Chairman Powell's most recent pronouncements, quoted above, may indicate that the Fed has again altered its projections in the last couple months, so that the December projections for 2023 will be above 2.2%. We will see. But one thing is clear; inflation is hard to project, even for the Fed. It may well be that the Fed will find it harder to get inflation back to its 2% target than it would like us to believe.
